BAH Rates 2026: Best Locations for Military Housing Allowance
BAH rates 2026 guide: how DoD sets basic allowance for housing by MHA, paygrade and dependents, the highest BAH rates, and whether a big allowance means more money.
The BAH rates 2026 are one of the few parts of military pay that swing dramatically by location, so if you have any say in where your next set of orders takes you, they are worth understanding. Two service members at the same paygrade, with the same dependent status, can see their monthly Basic Allowance for Housing differ by well over a thousand dollars depending on the ZIP code attached to their duty station. This guide walks through how the 2026 rates are built, which kinds of locations tend to pay the most, and the more important question that most "best BAH" lists skip entirely: whether a big number on your Leave and Earnings Statement actually leaves you better off.
Throughout, the goal is to give you the framework rather than a leaderboard of dollar amounts that goes stale the moment the Department of Defense publishes its next rate file. For the exact figure at any installation, run the location through the BAH calculator. It pulls the published military BAH rate for your specific Military Housing Area, paygrade, and dependent status, so you are looking at the real number rather than an estimate. And since BAH only makes sense next to the rest of your pay, the military pay calculator gives you the basic pay that sits underneath it.
How the BAH Rates 2026 Are Actually Set
Basic allowance for housing is not a single national figure. It is a grid of locality rates published once a year by the DoD Defense Travel Management Office, usually in mid-December for a January 1 effective date. The system has three inputs and only three: your Military Housing Area, your paygrade, and whether you have dependents. Everything downstream flows from those.
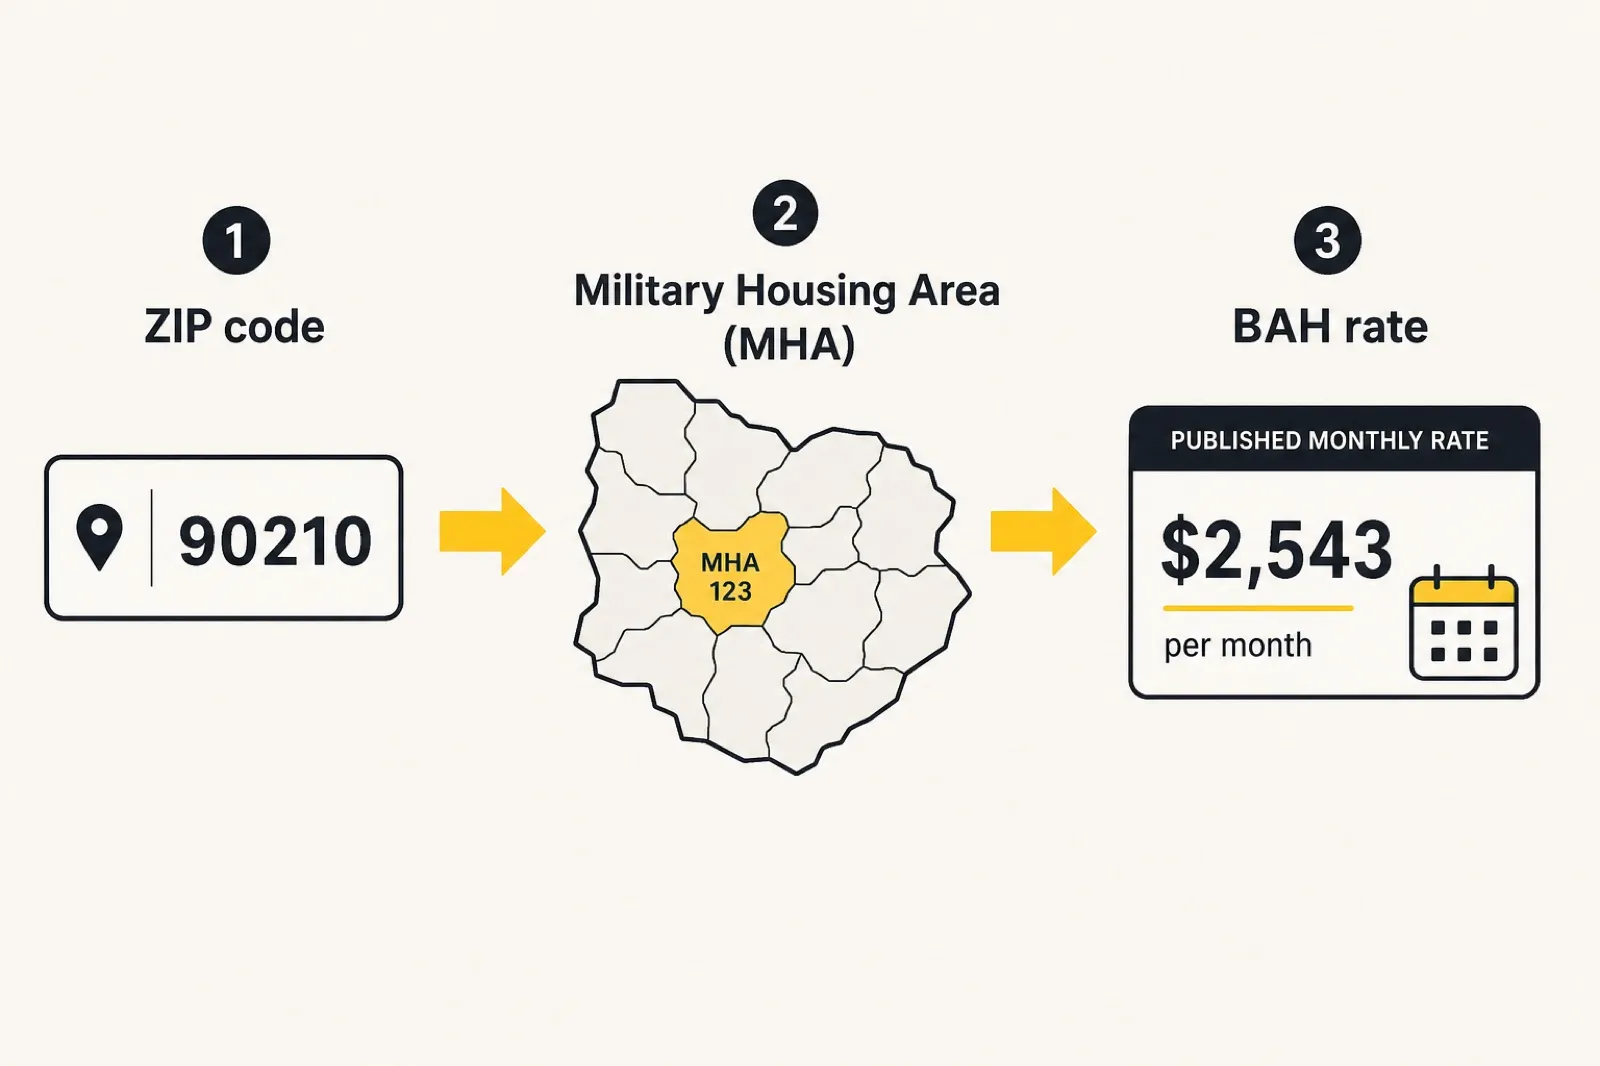
Your ZIP maps to a Military Housing Area
The country is divided into a few hundred Military Housing Areas. DTMO publishes an official ZIP-to-MHA crosswalk, so the ZIP code of your duty location resolves to exactly one MHA. That MHA is the unit DTMO uses to measure local housing cost. It is worth understanding that an MHA is a region, not a single town. A large metro MHA can sweep in several counties, which means the published rate reflects an area-wide rental market rather than the specific neighborhood you end up living in. This is the first place a high headline rate can mislead you, and we come back to it below.
Paygrade sets the housing "anchor"
Within an MHA, DTMO assigns each paygrade an anchor point that corresponds to a particular size and quality of housing. The intent is that a more senior member is expected to house a household in a larger or higher-quality unit, so the rate scales up with rank. The jumps are not linear and they are not the same in every MHA, because they track the actual cost difference between, say, a one-bedroom apartment and a three-bedroom single-family home in that specific market.
Dependent status splits every rate in two
Every MHA-and-paygrade combination has two published figures: a with-dependents rate and a without-dependents rate. Having even one dependent recognized by the DoD moves you to the higher of the two. BAH with dependents is the same whether you have one child or five; the allowance does not scale by family size. That surprises a lot of new arrivals, so it is worth saying plainly.
What "High BAH" Locations Have in Common
If you sort the 2026 rate file from the top, the installations that rise to the surface are not random. They share a small number of traits.
Expensive coastal and major-metro housing markets
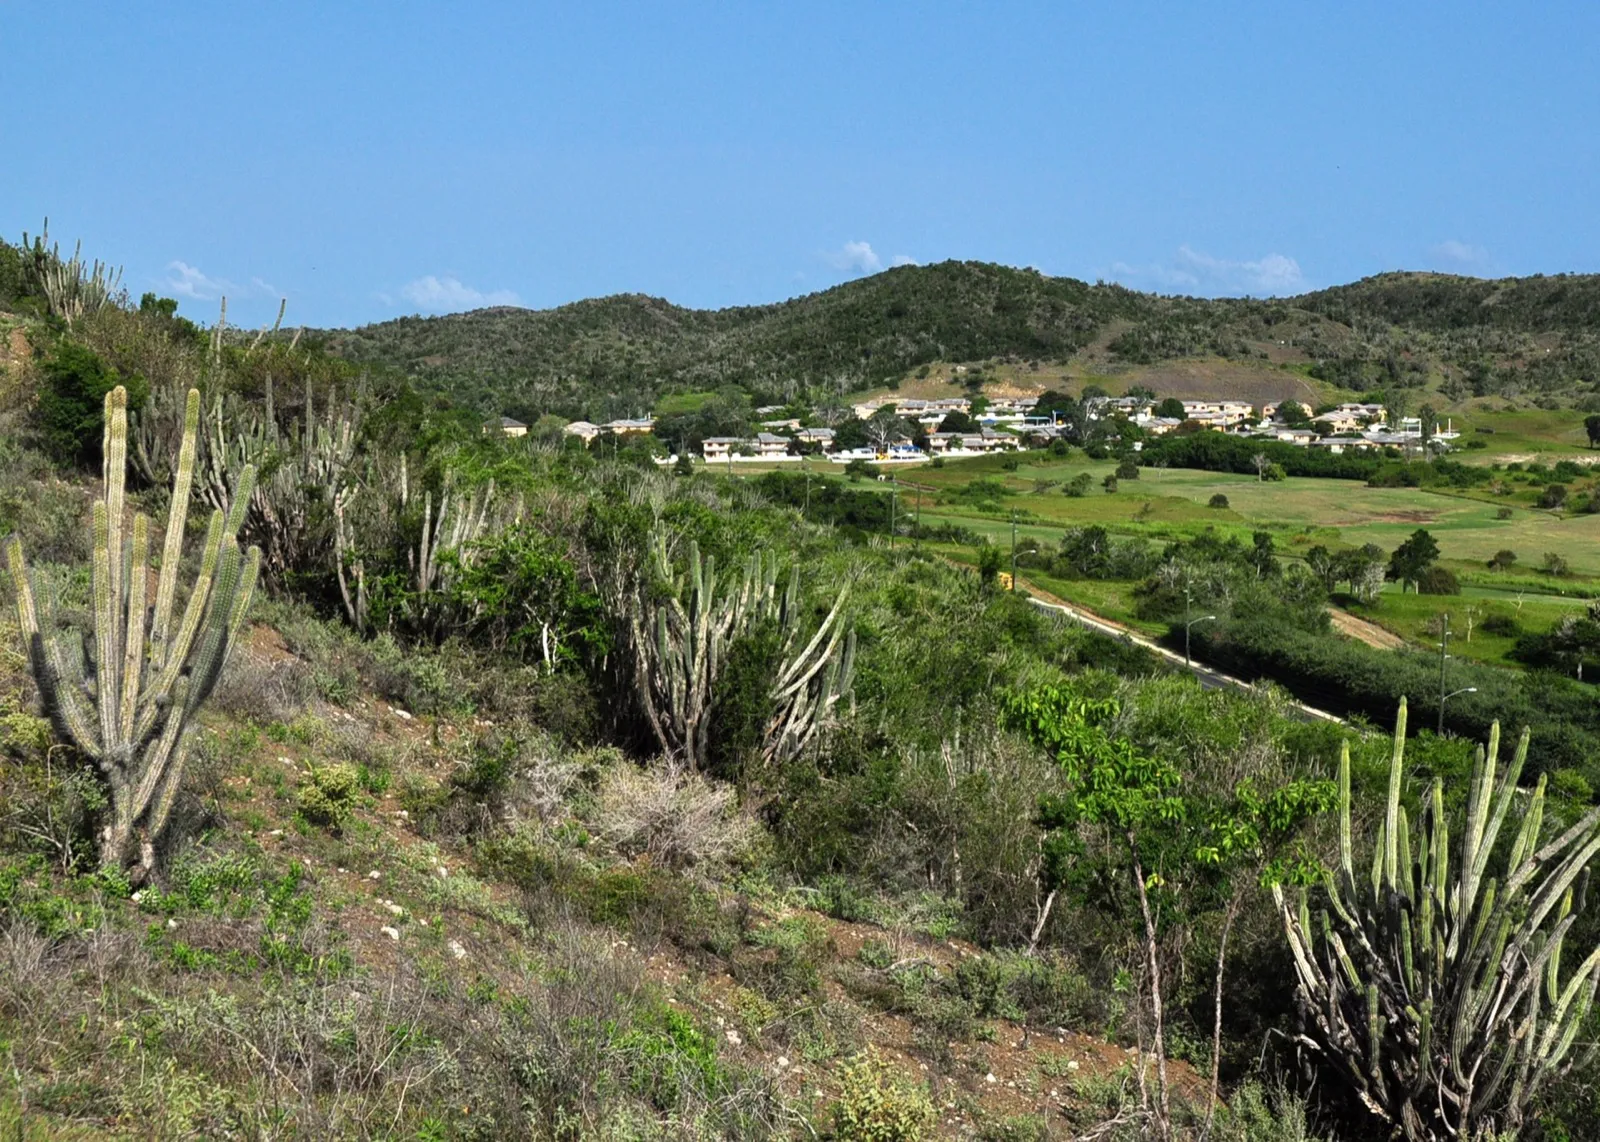
The single biggest driver is local rent. MHAs anchored to high-cost coastal metros and dense urban areas carry the largest allowances because DTMO is measuring a genuinely expensive rental market. Installations in and around major California metros, the greater Washington, D.C. region, the New York and New England corridor, and the Pacific Northwest consistently land near the top of the CONUS table. The rate is high because the rent is high, not because the assignment is a windfall.
Senior paygrades stretch the spread
The gap between the lowest and highest paygrade rate is widest in the priciest MHAs. In a low-cost rural MHA, the difference between an E-5 and an O-5 rate may be modest. In an expensive metro, that same paygrade spread can be enormous, because the underlying cost gap between a small apartment and a large family home in that market is itself enormous. If you are senior and stationed in a high-cost area, you are seeing the highest BAH rates in the entire system.
OCONUS is a different animal
This guide focuses on CONUS, the lower 48. Overseas duty stations and the non-contiguous states do not use BAH at all in the same way. Overseas, members draw the Overseas Housing Allowance, which works on a reimbursement model with a separate utility allowance and currency adjustments rather than a flat published rate. Alaska and Hawaii have their own dynamics layered with CONUS COLA. So when someone tells you a certain overseas base "has the highest BAH," they are usually comparing apples to oranges. If your interest is OCONUS, the mechanics in this guide do not transfer cleanly.
The Number That Matters Is Rent Minus BAH
Here is the part that the typical ranked list gets wrong. A bigger BAH is only an advantage if it outruns the local rent. BAH is calibrated so that, on average across an MHA, a typical member at a given anchor point covers a typical local rent and utilities. The system is designed to be roughly break-even for the median case, not to hand you a surplus. The real opportunity is in the gap between the published rate and what you personally can find.
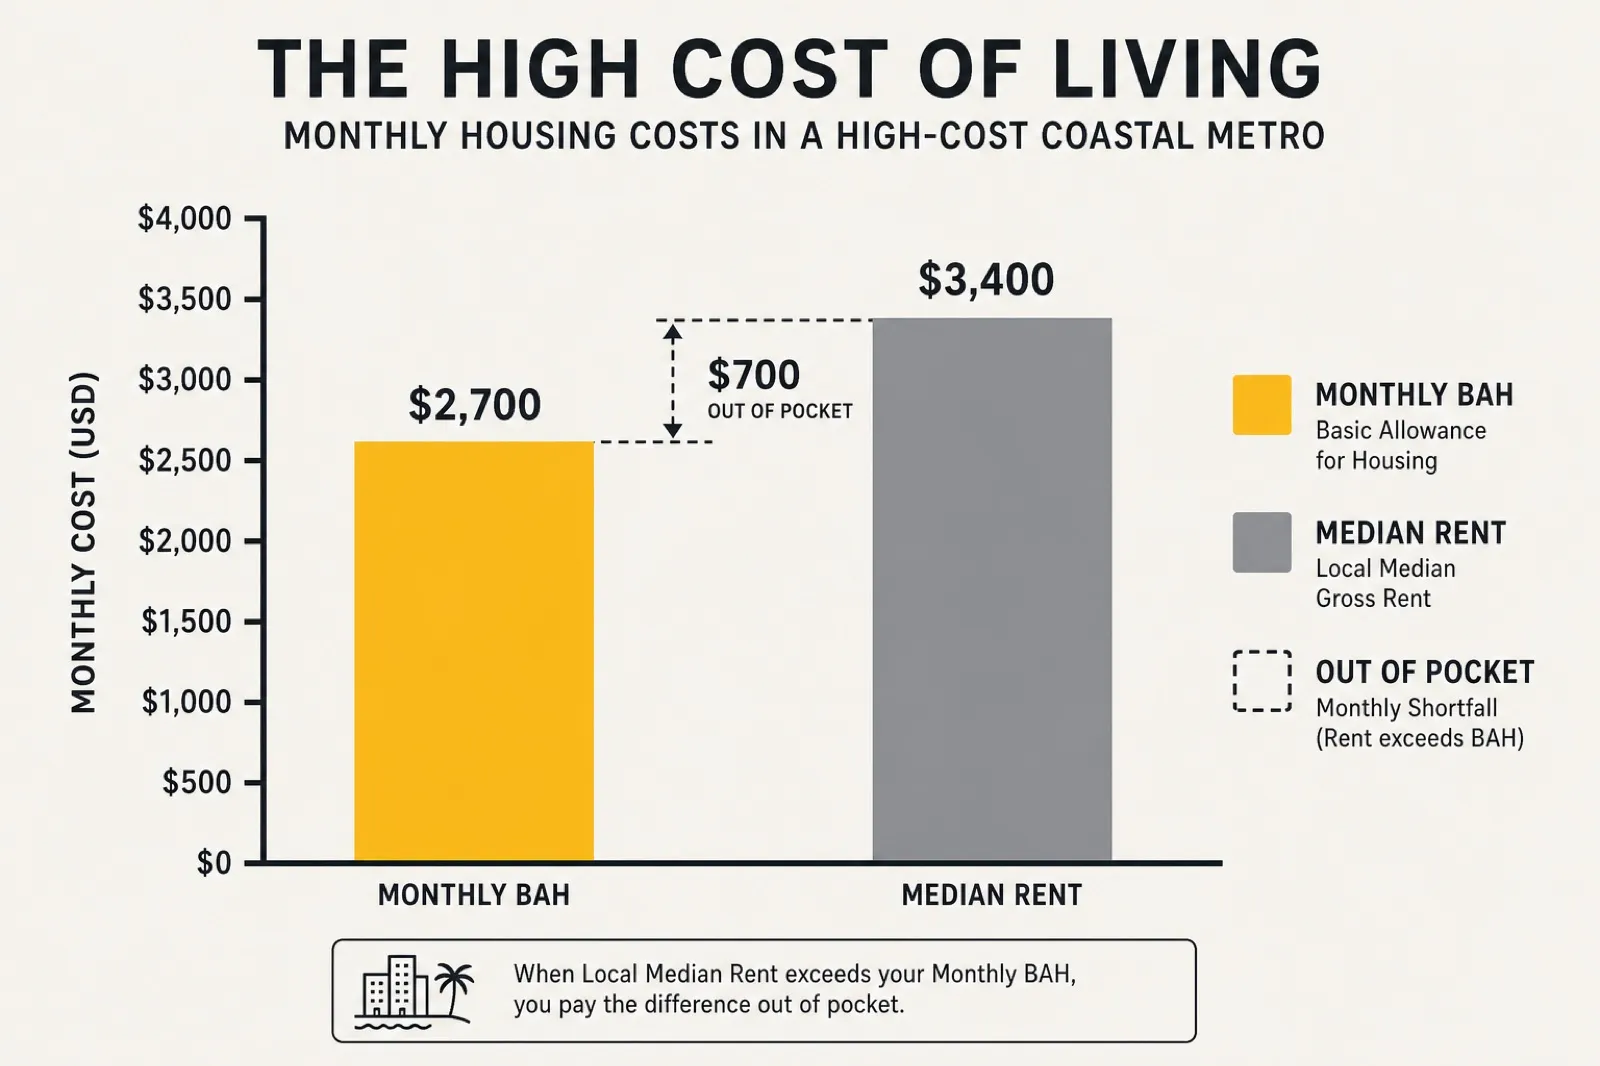
A high rate in an expensive market can leave you behind
Consider the most expensive coastal MHAs. The allowance is large, but the rental market that produced it is brutal, and the MHA averages in neighborhoods you may not be able to or want to live in. If the only housing within a reasonable commute rents for more than your anchor rate, a chart-topping BAH still leaves you paying the overage out of pocket. The headline figure looked great; the lived experience is a monthly shortfall.
A modest rate in a soft market can leave you ahead
The reverse is the quiet win. In a mid-cost MHA where the rental market has cooled or where you can buy with a VA loan and your mortgage payment sits comfortably below the allowance, a perfectly ordinary BAH figure can produce real monthly margin. Members who optimize for surplus rather than for the biggest headline number tend to do this on purpose: pick the assignment where the gap between the published rate and the realistic local cost is widest in their favor.
Run your own gap, do not trust the ranking
Because rent moves faster than the annual DTMO file and because the MHA is an average, the only reliable way to evaluate a location is to put your real numbers next to the published rate. Pull the BAH figure for the exact paygrade and dependent status you will hold at the installation, then compare it against current asking rents or a realistic mortgage for the kind of housing you actually want. The BAH calculator gives you the published side of that comparison in a couple of seconds, and you can check two ZIPs against each other before you ever submit a preference.
Reading the 2026 Rates Without Getting Burned
A few practical cautions will save you from the most common misreads of the rate table.
Rate protection means your LES may not match the table
BAH rate protection ensures that an individual rate generally does not drop below what you were already receiving at a station, even if the published rate for that MHA falls in a later year. That is good for you, but it means a coworker who arrived a year earlier may legitimately draw a different figure than the current published rate for the same MHA, paygrade, and dependent status. The table shows what a new arrival receives, which is the right number for evaluating orders.
Junior enlisted in barracks usually receive $0
E-1 through E-4 members in single-type-1 barracks generally do not draw BAH at all, because government quarters are provided. The published rates for those grades apply when the member is authorized to live off base or has dependents. If you are looking at a low paygrade and a barracks billet, treat the table figure as conditional rather than guaranteed.
Mid-year changes are normal
A promotion, a marriage, a new dependent, or a permanent change of station can all move your rate partway through the year. The annual file is a January 1 snapshot. If your circumstances change, your allowance changes with them, and your January figure is no longer the relevant one. This is another reason to lean on the calculator for your specific, current situation rather than memorizing a year-start number.
How to Use This When Choosing or Ranking Assignments
If you genuinely get to express a preference, treat BAH as one weighted input rather than the deciding factor.
Step one: list the realistic candidate locations
Start from the assignments actually available to you. There is no value in admiring the BAH at a base you will never be sent to. Narrow to the real set first.
Step two: pull the published rate for each
For every candidate, look up the with- or without-dependents rate at your paygrade. Do this for the paygrade you will hold on arrival, not the one you hold today, if a promotion is imminent. Keep the figures side by side.
Step three: estimate realistic local housing cost
For each location, find what the housing you actually want costs right now: current rents for the right size unit in a commutable area, or a realistic mortgage payment if you intend to buy. This is the number the ranked lists never show, and it is the one that decides whether the assignment helps or hurts your budget.
Step four: compare the gap, then weigh quality of life
Subtract realistic housing cost from BAH for each location. The location with the largest favorable gap is the one where housing allowance does the most for you, regardless of where it sits on a national leaderboard. Then layer in everything BAH does not capture: commute, schools, spouse employment, proximity to family, and cost of living beyond housing, where CONUS COLA can matter in a handful of high-cost areas. BAH is a powerful input, but it is an input, not the answer.
Frequently Asked Questions
What is BAH?
BAH is the Basic Allowance for Housing, a monthly U.S. military allowance that helps cover off-base housing costs when government quarters are not provided. It is paid on top of base pay and is not taxed. The amount is set by your Military Housing Area, paygrade, and dependent status.
What is basic allowance for housing?
Basic allowance for housing is the full name for BAH. It is a locality-based pay that reimburses service members for a typical local rent and utilities at their anchor point. The DoD publishes a separate with-dependents and without-dependents figure for every paygrade in every Military Housing Area.
What are the 2026 BAH rates?
The 2026 BAH rates are the grid of locality figures the DoD set effective January 1, 2026, one per paygrade and dependent status within each Military Housing Area. There is no single national number; each installation maps to its own MHA rate. Look up the exact figure for any location with the BAH calculator.
When will the 2026 BAH rates be released?
The DoD Defense Travel Management Office typically publishes each year's BAH rate file in mid-December for a January 1 effective date, so the 2026 rates were released around mid-December 2025. New rates follow the same December-to-January cycle every year.
What are the highest BAH rates?
The highest BAH rates cluster in the most expensive coastal and major-metro housing markets and at the most senior paygrades, because the allowance tracks local rent and rank. Installations near major California metros, the Washington, D.C. region, the New York and New England corridor, and the Pacific Northwest consistently sit near the top of the CONUS table. A high rate reflects high rent, not a windfall.
How is BAH calculated by location?
BAH is calculated from three inputs: your Military Housing Area, your paygrade, and whether you have dependents. The DoD maps your duty ZIP code to one MHA, measures the area-wide rental market, and assigns each paygrade an anchor cost that scales up with rank. Use the BAH calculator to see the published rate for your exact location and status.
The Bottom Line on "Best" BAH Locations
The honest answer to "where is BAH highest in 2026" is that the largest dollar figures cluster in the most expensive coastal and major-metro housing markets and at the most senior paygrades, because the allowance is a direct function of local rent and rank. But the largest figure is rarely the best deal. The best location for you is the one where the published rate most comfortably exceeds the real cost of the housing you want, and that is a calculation only you can run with your own paygrade, dependent status, and target installation.
Skip the static leaderboards that go out of date every December. Pull the actual 2026 rate for the locations on your list, set it next to real local rents, and let the gap decide. The published side of that comparison is one lookup away in the BAH calculator.